Reduce Software Inventory and Increase Value Delivered
Let’s start with a confession: I used to hate the term “DevOps”. It was fuzzy, unclear, and worse of all, it meant different things to different people. Over the past couple of years however, the term has solidified and has become the global meaning of modern practices for integration and delivery. The effectiveness with which we complete the software development lifecycle loop – that is, how long it takes to deliver “development done” code to customers and get feedback – is effectively how we measure DevOps performance. This performance is becoming more and more a measure of business agility and the companies that respond to customers’ needs the fastest win.
The time and effort that it takes for software organizations to design and implement modern DevOps practices AND deliver “done” software to customers is often lost on the eyes of parties outside the development organization and thus not enough time is spent on design and implementation. Because of this, faster implementation cycles are favored; however, these faster cycles may ignore key data points that allow software teams to identify and enhance value delivery as well as have clear visibility.
Lost in Translation #
Requirements and user stories start their life as words and narrative, and ultimately end up in code. Code bits don’t translate well to system requirements and doing so is difficult and time-consuming. Because of this, losing track of value delivery is often a side-effect of the development cycle. Agile teams generally do not track their work past the “done” stage and players at all levels become frustrated with the inherent lack of visibility into the delivery process. This in turn translates into missed opportunities to identify red flags in the delivery process as well as missed opportunities to identify issues early.
Relief as a Service #
The pain and frustration of not being able to identify where your software is in the delivery cycle was the main motivation behind features such as Delivery at a Glance. We are now taking things a step further with features that provide further visibility.
Package Metrics #
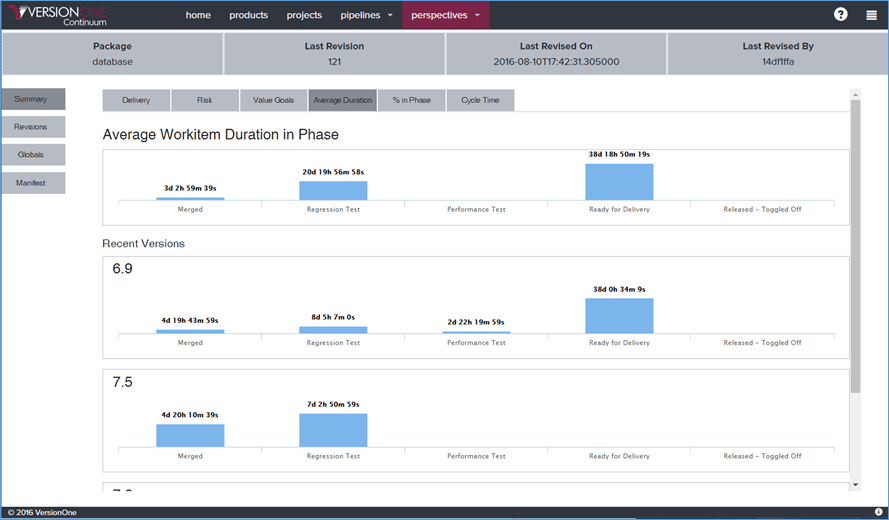 Package Metrics
The first step to identify opportunities is to understand how well the flow is moving. Getting precise information about how value is moving across your delivery workflow is critical in order to improve. Using standard lean metrics, we implemented detailed metrics around the packages that carry the code commits you’ve worked so hard to deliver. Metrics such as:
Average Duration of Stories in a Given Phase: We’ve often seen software that is “done” sitting on a “ready for delivery” phase for an extended period of time. This is an investment that has been paid without end users taking advantage of the added value. This metric additionally allows you to identify problem areas, phases, or environments where code may be staying for long periods of time.
Percentage of Time Stories Spend on Phase: This metric allows you to identify the phases where your stories spend most of their time. It allows you to identify trends as well as bottlenecks. This in turn allows you to plan improvements to speed up the cycle.
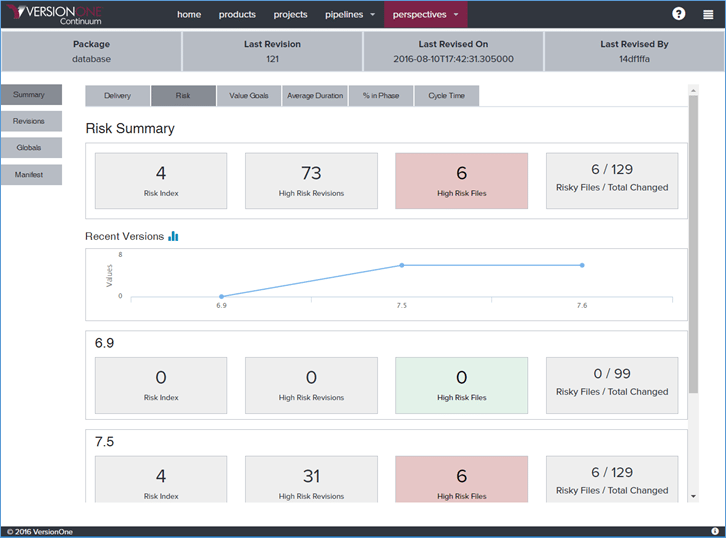 Continuum Package Risk
Package Risk: Each source file that contains commits for a given package is assigned a risk factor which in turn assign the package a “risk index”. This allows you to identify both the risk of the release as well as the number of high risk files that are contained in a given package.
Delivery at a Glance – View by Portfolio Item #
 Lifecycle – Delivery at a Glance board
Delivery at a Glance has served delivery teams very well in identifying both the location of value (in the form of packages/stories) across the delivery workflow and in identifying areas of opportunity where additional attention is needed. We have received a lot of positive feedback on this feature, as well as feedback from business users (program/product managers, etc.) who wanted to view their work from the same perspective.
Delivery at a Glance now offers a “View by Portfolio Item” toggle which allows you to view the distribution of work items across your delivery workflow by Portfolio Item. This mode also offers the number of work items that have are “done vs. delivered”, allowing you to identify work that has been completed but not yet shipped.
Tracking the value that is moving across your delivery flow has never been easier. Leveraging your existing tool set, you can configure VersionOne Continuum to track and monitor your commits to provide increased visibility to all stakeholders all the way to the customer’s hands. Continuum will in turn automatically feed the necessary data to VersionOne Lifecycle in order to visualize your delivery flow in the Delivery at a Glance board.
Identifying trends and red flags early allows you to both improve your delivery workflow as well as fix problems early. Speed up your delivery cycle by improving the phase with the most opportunities and achieve business agility.